


Competitive analysis of the top orbital rockets via launch cadence and payload flow
The sustained pace of improvement for SpaceX Falcon 9 launch cadence is unmatched by any other orbital rocket in history, resulting in an incredible lead in the flow of payload mass to orbit


Importance of Launch Cadence
Increased mass flow to orbit driven by accelerated launch cadence1 can be orders of magnitude bigger than vehicle performance improvements2.
As discussed earlier, the Falcon 9 launch cadence learning curve (a.k.a. Wright’s Law) — the rate at which the pace of launching increases for every doubling of total launches — was 37% for 2010-2019, followed by 58% from 2020 to today (upper left panel). Over that time Falcon 9 launch cadence improved from about 2 per year to 132 in 2024 and the trend predicts 177 launches for 2025. So how does this compare to the other high cadence rockets in history?
Cadence learning curves for the top orbital launch vehicles
In this article I’ve plotted the learning curves for Falcon 9 and nineteen additional orbital class rockets with the greatest numbers of total launches (six rockets are still active). I’ve also included Rocket Lab’s small payload rocket Electron and the Starship/Superheavy orbital-class test vehicle for comparison. For each rocket the average number of days between launches (DBL) for a given year (the time “cost” of a launch) is plotted against the cumulative number of launches (x-axis). Horizontal lines indicate launch cadence milestones of monthly, weekly, and every other day. The plots are arranged in decreasing order of the best annual average cadence (lowest plotted data point) achieved by each launch vehicle. Data from GCAT (J. McDowell, planet4589.org/space/gcat).
Let’s take a closer look at that initial chart. It shows six launch vehicles: Falcon 9, Soyuz-U, Voskhod 11A57, Kosmos 11K65M, Thor-Agena, and Atlas-Agena. Cumulative launch total (CL) is on the x-axis, annual average days between launches (DBL) on the y-axis. Each data point corresponds to a calendar year. All data are plotted on the same log scale from 1-1000. A sustained learning rate is visible as a linear downward sloping trend. The steeper the line, the faster the improvement in cadence.

Falcon 9 (upper left) stands out with 15 years of improvement thus far, reaching a cadence of 2.3 days between launches (DBL) as of February 2025. Soyuz-U, with nearly 800 launches from 1973 to 2017, came close to achieving a weekly cadence (7.8 DBL) in 1977. For the rest of the rockets the best annual average cadence (minimum DBL) drops as we move through the list, with the Thor- and Atlas-Agena rockets at about a bi-weekly cadence. Note the fishhook shape of the data for the five rockets besides Falcon 9. An initial period of cadence acceleration over approximately 5-10 years is followed by a stable launch rate and then rapidly rising (i.e. worsening) days between launches as usage of the rocket diminishes. The Voskhod 11A57 (a.k.a. Kosmos-3M) mild reduction in cadence at the end is a slight exception. In contrast, Atlas Agena had a very short period of stability and a dramatic increase in DBL at end of life. Note that chronologically these steep increases in DBL with many annual data points are actually long tails of decreased cadence. A full nine years of decrease, in the case of Atlas Agena.
Here are the rest of the launch cadence learning curves:

Moving through this set of rockets, annual launch cadence is about bi-weekly at the start and decreases to less than monthly intervals (DBL of 30+ days). I’ve included Electron and Starship for comparison; both are currently increasing cadence.
Soyuz-2, Chang Zheng 2D, Electron, Chang Zheng 3B, and Starship are active rockets and at first glance all exhibit continual improvement in launch cadence. However, upon close inspection, Soyuz-2, CZ 2D and CZ 3B each show an increase in DBL for the last three years, indicative of a plateau in cadence (the very low DBL of the last point for CZ 3B is possibly an artifact because of three closely spaced launches Dec 2024- Jan 2025). The last point for Electron with an elevated DBL for 2025 YTD is also anomalous, reflecting a gap in launches during the beginning of 2025.
Again we see the common fishhook curve for all the inactive rockets. The Space Shuttle plot is sobering; the effect of both shuttle accidents is visible in the sharp decrease in cadence in subsequent years as the program worked to recover. For the first six years, the Shuttle launch cadence had been steadily improving.
Mass to Orbit
Dividing the maximum payload for each launch vehicle3 by the minimum days between launch (max cadence) predicts the maximum flow rate of payload mass to orbit in kg/day. Falcon 9 current mass flow is far greater than any other launch platform and continues to increase.

In the chart below I’ve graphed the maximum mass flow for each launch vehicle against its single launch payload lift capacity and color coded by best achieved launch cadence (days between launches). The key takeaway — Falcon 9 enables a much higher mass to orbit flow rate by combining a heavy lift payload capacity with launches occurring almost every two days. I’ve added three dashed lines to help visualize the relationship between single payload mass and mass flow for three levels of cadence: 2, 7, and 30 days between launches. Quite a few rockets are near the 30 DBL line, and Soyuz-U (7.8 days between launches) is visible just under the 7 DBL line. The Space Shuttle achieved nearly the same operational mass flow (fourth highest overall) at about 1/4 the cadence of Soyuz-U.
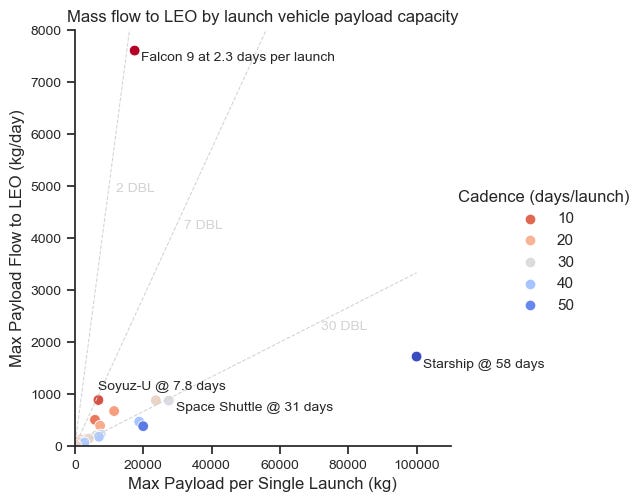
Starship is still in testing, but the implications are clear. Launching at the current Falcon 9 cadence, Starship would be able to deliver the entire mass of the ISS (~420 tonnes) to LEO in 10 days.
In a follow up article, we’ll look deeper into the details of the launch history and learning curves for these rockets, calculate the maximum learning rates achieved and estimate the initial development time cost for their first launch. With that information, we’ll make some predictions about the performance of the newest crop of rockets coming on line — Blue Origin’s New Glenn, ULA’s Vulcan Centaur, Ariane 6, and others.
Especially cadence enabled by reusability and associated lower costs, which drives demand for large amounts of payload.
This is not to downplay the incredible hard and innovative work needed to optimize launch vehicle performance and especially to enable re-usability. But, on top of that foundational capability you can then optimize the pace of launches — and resulting mass flow — by 100-, 1000-fold, or more. In the coming years the logistical supply chains, organizational structures and regulatory landscape will need to experience their own learning curves to support this, but that’s a topic for another time.
Maximum payload mass includes some rocket configurations that only flew a handful of times. Data from wikipedia. Starship payload estimated at 100,000 kg.